
This article was a collaboration between thinkPARALLAX Strategist Shara Narsipur and Anna Seskind, Sr. Strategist - Sr. Project Operations Manager.
Visual communication is the practice of sharing information through visual elements — using images, symbols, and graphics to convey a message rather than relying solely on text. Examples range from dashboards, charts, and data visualizations to photography and video. These tools distill complex ideas into formats that are easier to understand, remember, and act on.
According to recent research, the majority of global business leaders recognize the power of visual communication:
- 90% agree that visual methods increase efficiency
- 89% say they enhance collaboration
- 85% believe visuals carry more authority than other communication methods
In sustainability reporting specifically, where credibility and stakeholder trust are paramount, that authority matters. A well-designed infographic demonstrates that your organization has thought deeply about how to communicate its impact.
Our process for creating successful sustainability infographics
As part of the reporting process, we’re often referencing technical terminology, sprawling data sets, and multi-layered concepts. Concepts like the value chain, carbon accounting methodologies, Scope 3 emissions, and circular economy principles can be dense for readers without a technical sustainability background. Furthermore, when stakeholders encounter page after page of text-heavy explanations, even the most important insights can get lost.
This is precisely why tPX leverages infographics as an essential tool in our reporting repertoire. Almost all our reports have some level of infographic development as part of their scope. They don’t just make content prettier; they make it accessible, memorable, and actionable.
The “parallax” approach
In many ways, our infographic development process at tPX is a perfect example of how our team shines. This process requires what we call a “parallax” approach — bringing strategists, writers, designers, and art directors together to collaborate from the very beginning. Each team member brings a unique perspective and skillset, which, when combined, have the power to transform complex ideas into concise and compelling graphics that can be used time and time again.
- Our strategy team identifies the core message that needs to land with the target audience.
- Writers distill complex ideas into digestible narratives and consider how the infographic will flow in the context of the report.
- Designers translate those narratives into visual language. Art directors ensure the final product not only communicates clearly but also allows the brand’s personality to shine through.
How to make a great infographic
After developing hundreds of sustainability reports, tPX has found a few ways to successfully capture complex sustainability data in visual formats:
- Distill your main point first: Before putting pen to paper, work to distill the single main point you’re hoping to get across. This clarity of purpose becomes your north star throughout the creation process.
- Start with the concept, then draft a few rough sketches of how it could come to life: It’s only after you’ve validated the concept and structure that you should fill in the detailed data, refined illustrations, and enough copy to explain the graphic (labels, headlines, supporting text).
- Tailor to your audience: Consider how much your audience already knows about the topic. An infographic for sustainability professionals can use more technical language and assume baseline knowledge. One for general consumers or investors might need to explain foundational concepts first.
- Bring in subject matter experts: Data accuracy and illustration precision matter enormously in sustainability communications, where greenwashing concerns are ever-present. Loop in subject matter experts early to ensure your data is reliable and your visualizations accurately represent processes or concepts.
- Consider use cases beyond the report: when creating the asset, think through how else it might be used, from presentation decks to social posts and beyond. Ensure the design approach will be able to stand alone from the report content in order to get the most use out of what you create.
The opportunity for playfulness
When done well, infographics can create an emotional connection in a way that pure data never will. Ultimately, infographics represent an opportunity to blend quantitative metrics with creative expression, where your brand can truly shine through. Thoughtful color choices, illustrative style, and creative data presentation can make sustainability content feel less like a compliance exercise and more like an engaging story.
Five ways to demonstrate impact through infographics
Browse examples across our past and present clients for ideas on how to bring these tips and tricks to life!
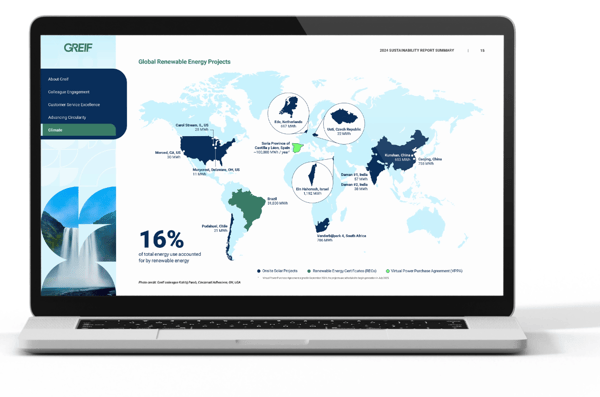
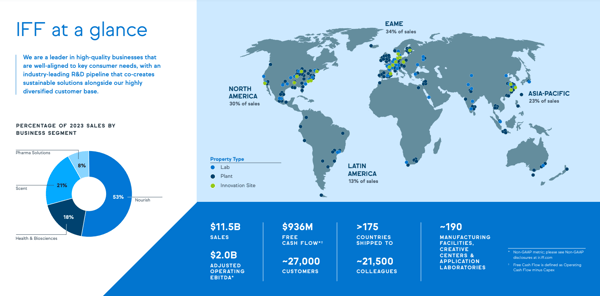
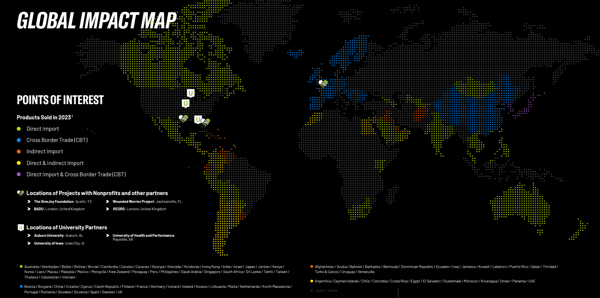
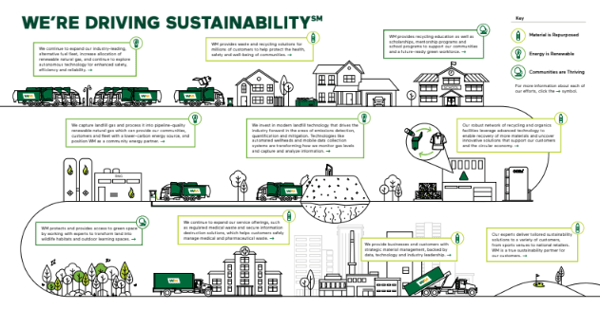
1. Use a map to convey geographic scale
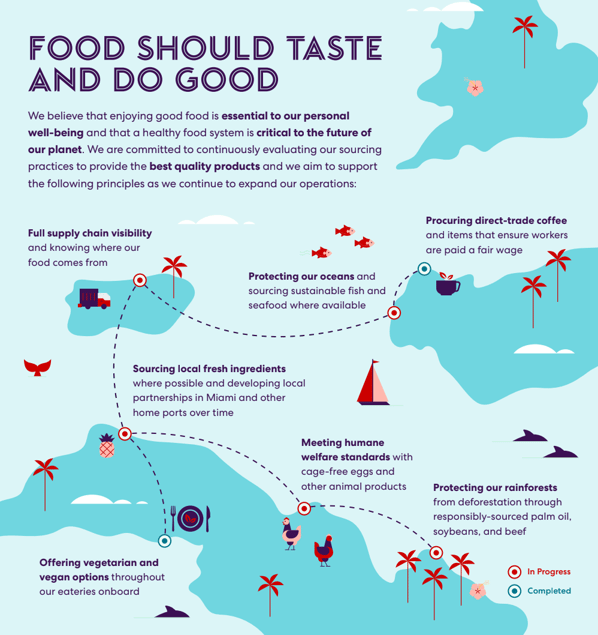
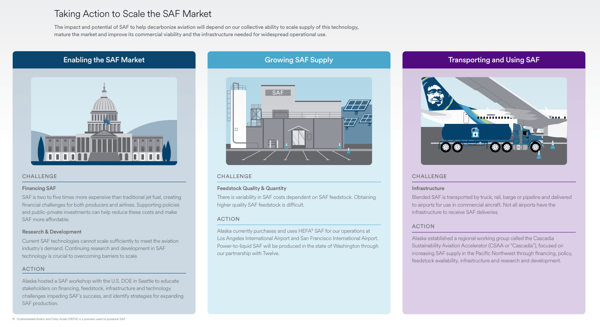
2. Break down a strategy into digestible parts
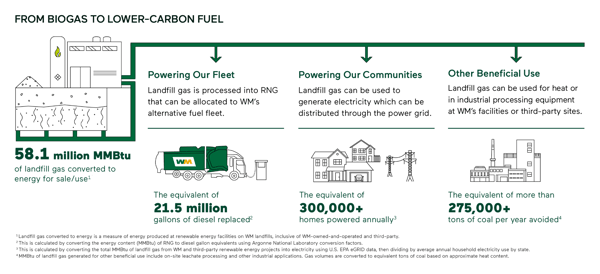
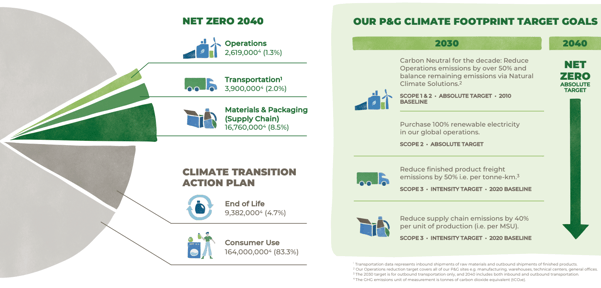
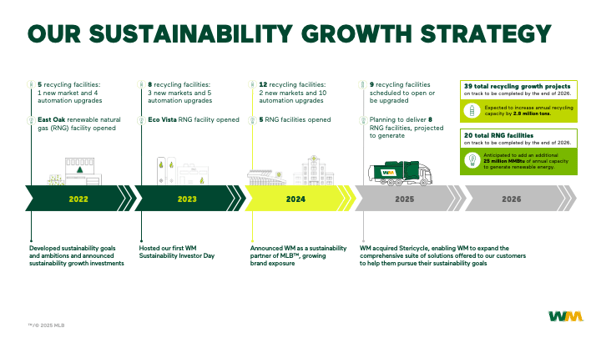
3. Track and quantify progress toward goals
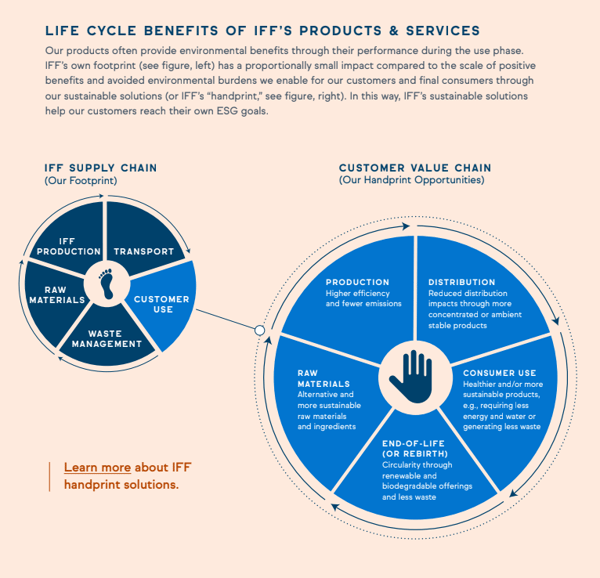
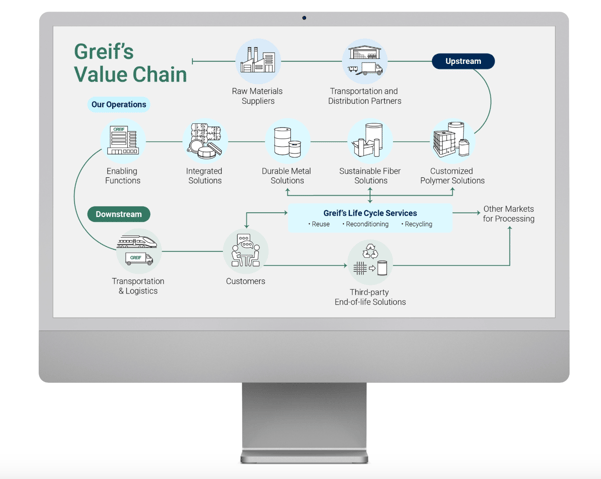
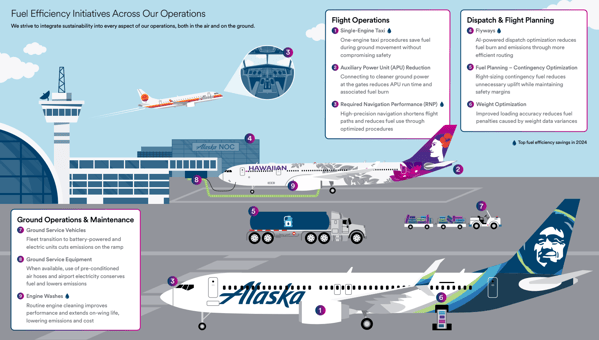
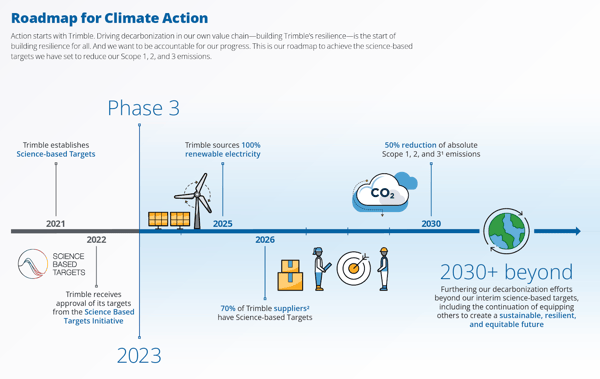
4. Connect the dots of your sustainability strategy
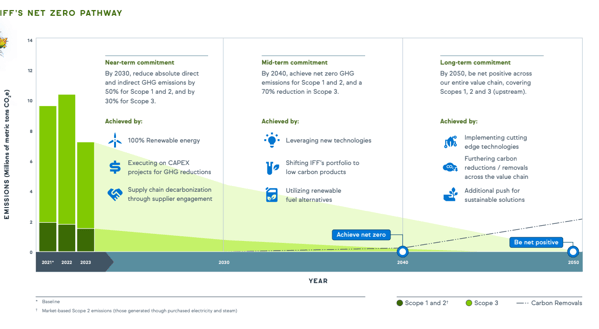
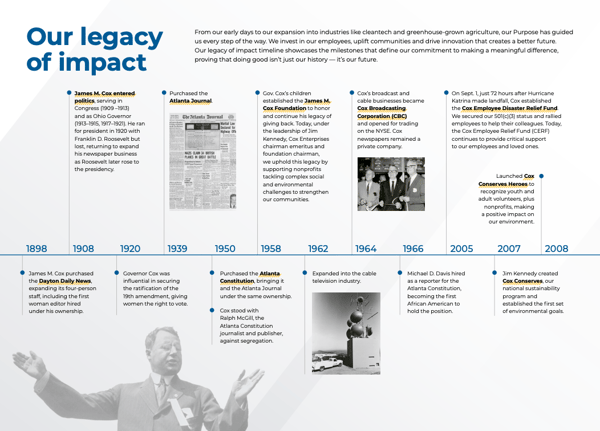
5. Plot growth and innovation over time
Ready to transform your sustainability data into compelling visual stories? thinkPARALLAX creates infographics that make complex sustainability information accessible, memorable, and actionable. Let's talk about your reporting needs.